1. 简介
pprof 是 go 自带的一个对程序的性能进行可视化和分析的工具,它从 profile.proto 格式的采样数据集中读取数据,并生成可视化报告,帮助我们分析我们的程序性能,进而有所针对进行优化。
当服务在运行时,有时候会遇到内存占用越来越大、将机器的CPU占满、goroutine数量暴涨的情况,或者当我们准备针对已有的代码进行运行效率、内存占用等方面进行优化,这时候就是 pprof 可以派上用场的时候了。
pprof 的采集方式分为以下几种:
- runtime/pprof:采集程序指定区块的运行数据,生成 profile.proto 文件并对其进行分析。
- net/http/pprof:基于 HTTP Server 运行,并且可以采集运行时数据进行分析。
- go test:通过运行测试用例,并指定所需标识来进行采集。
pprof 可以分析包含以下几种:
- CPU Profiling:CPU 分析,按照一定的频率采集所监听的应用程序 CPU(含寄存器)的使用情况,可确定应用程序在主动消耗 CPU 周期时花费时间的位置。
- Memory Profiling:内存分析,在应用程序进行堆分配时记录堆栈跟踪,用于监视当前和历史内存使用情况,以及检查内存泄漏。
- Goroutine Profiling: Goroutine 分析,可以对当前应用程序正在运行的 Goroutine 进行堆栈跟踪和分析。
- Mutex Profiling:互斥锁分析,报告互斥锁的竞争情况。
- Block Profiling:阻塞分析,记录协程阻塞等待同步的情况。
采集后支持通过生成报告、终端命令行、Web界面的形式进行分析。
2. 使用方式
2.1 net/http/pprof 端口监听
该方式适合于服务型应用,通过添加监听端口,采集 HTTP Server 运行时的数据进行分析。
代码示例:开启一个协程监听一个端口,然后对一个字符串不断地追加内容。
package main

import (
	"log"
	"net/http"
	_ "net/http/pprof"
	"time"
)

var datas []string

func main() {
	go func() {
		_ = http.ListenAndServe(":8080", nil)
	}()
	for {
		log.Printf("len: %d", add("go pprof add text"))
		time.Sleep(time.Millisecond * 10)
	}
}

func add(str string) int {
	data := []byte(str)
	datas = append(datas, string(data))
	return len(datas)
}
之所以需要对 net/http/pprof 进行空白导入,是因为该包在源代码 pprof.go 中对 /debug/pprof/ 下的几个路径进行了路由注册。
func init() {
	http.HandleFunc("/debug/pprof/", Index)
	http.HandleFunc("/debug/pprof/cmdline", Cmdline)
	http.HandleFunc("/debug/pprof/profile", Profile)
	http.HandleFunc("/debug/pprof/symbol", Symbol)
	http.HandleFunc("/debug/pprof/trace", Trace)
}
如果所要进行分析的程序是一个 Web 服务,已经开启端口监听,对外提供 HTTP 请求接口服务,则只需要对 net/http/pprof 包进行空白导入,即可通过其他命令进行数据分析。
import _ "net/http/pprof"
2.1.1 生成报告分析
运行程序,然后在程序运行的期间在浏览器访问网址:http://localhost:8080/debug/pprof/
打开后可以看到:
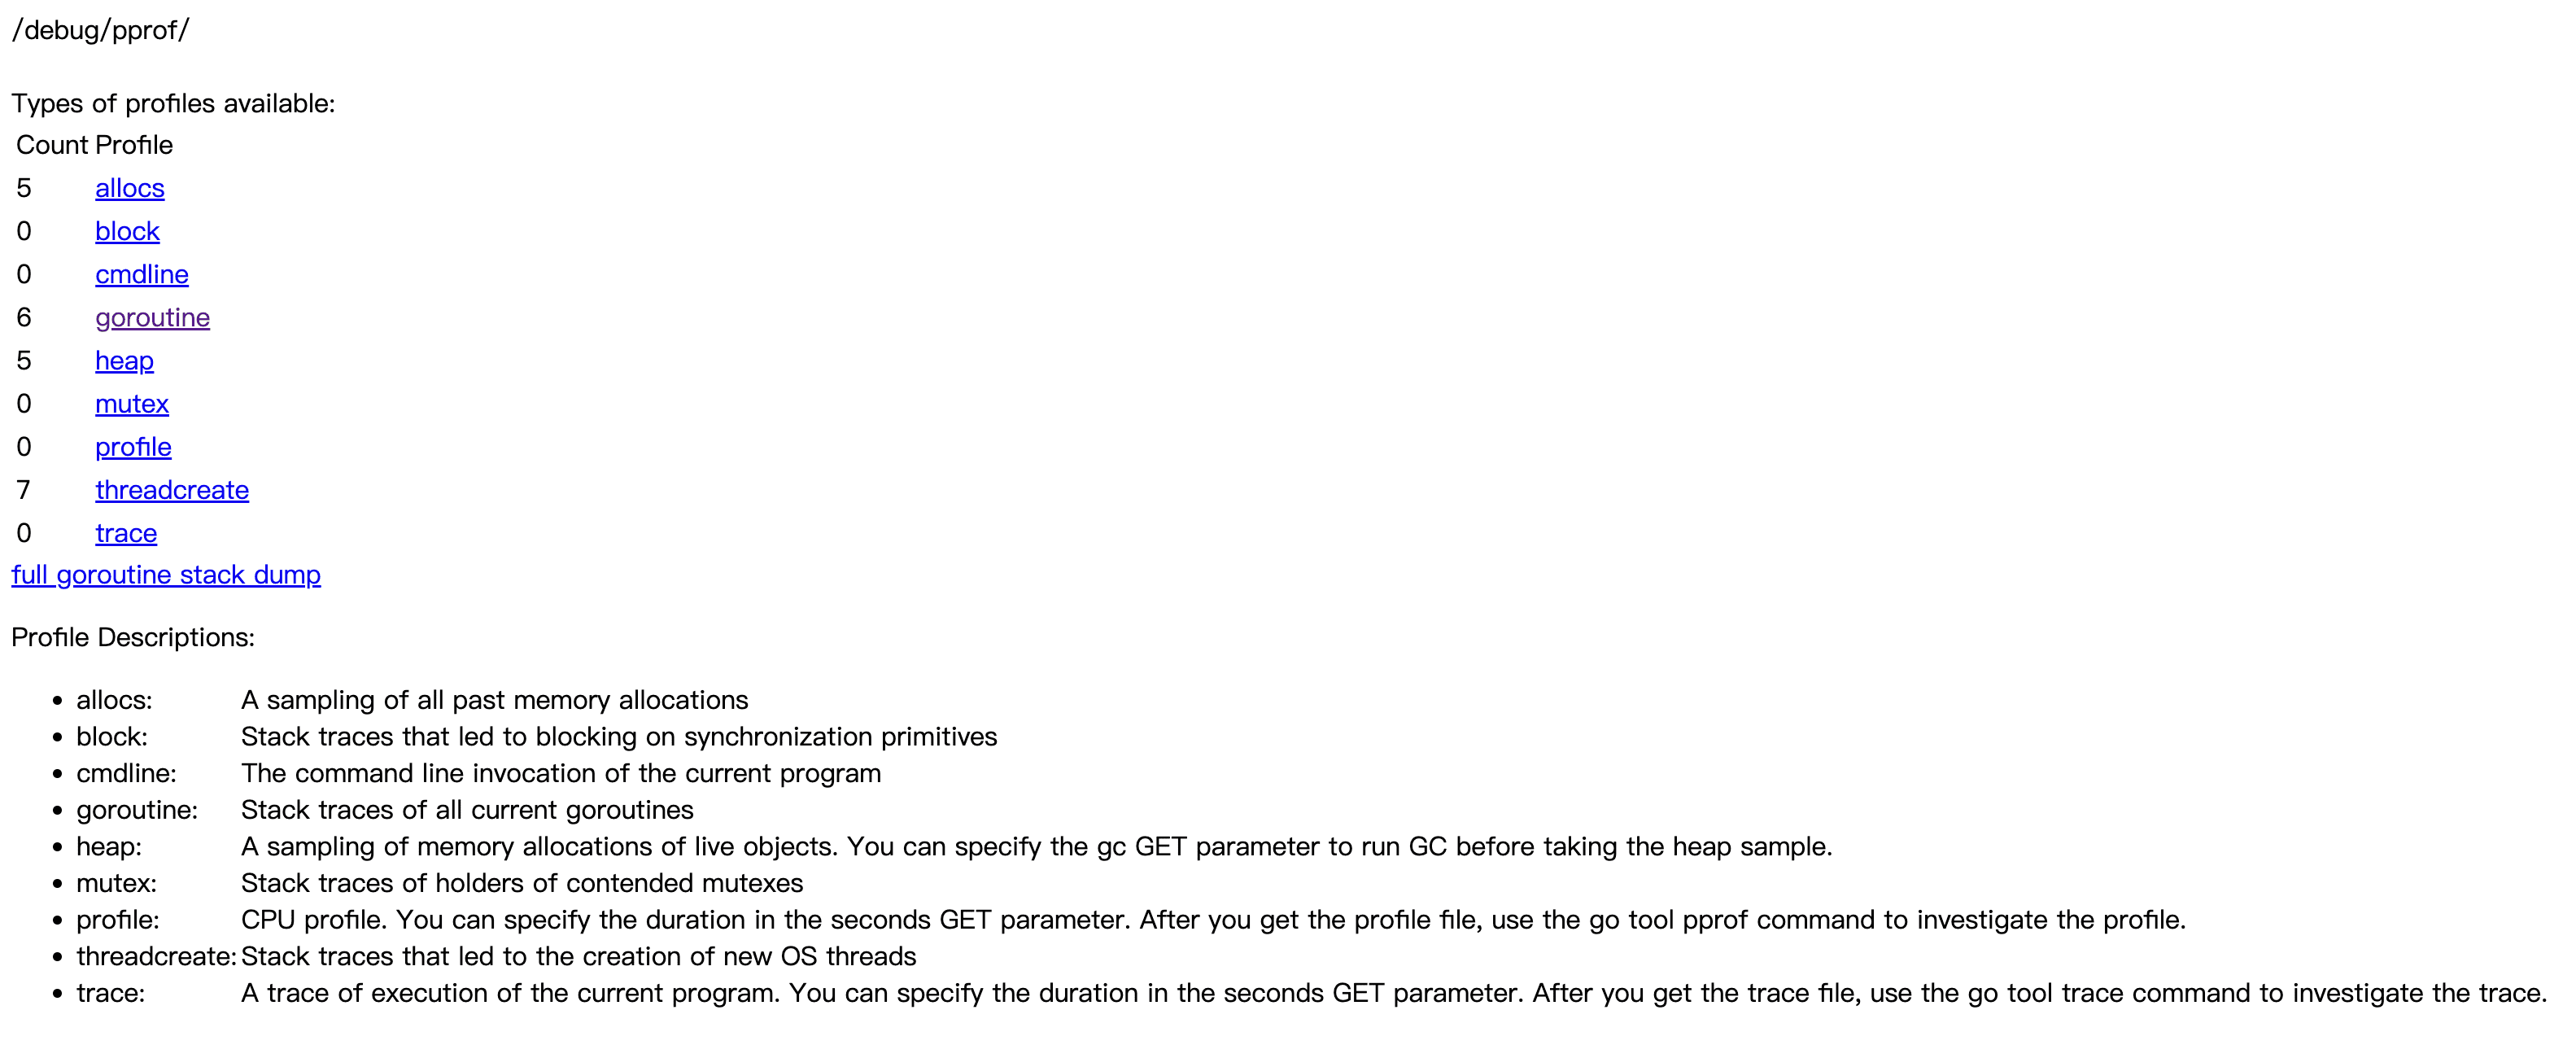
可以看到一些分析指标的数量以及链接,可以点击链接查看详情。这些分析指标对应的含义是:
- allocs:查看过去所有的内存分配信息。
- block:查看导致阻塞同步的堆栈跟踪。
- cmdline:当前程序的命令行的完整调用路径。
- goroutine:查看当前所有运行的 goroutines 堆栈跟踪。
- heap:查看活动对象的内存分配情况。
- mutex:查看导致互斥锁的竞争持有者的堆栈跟踪。
- profile:进行CPU分析,可以通过GET请求参数指定时间范围。
- threadcreate:查看创建新操作系统线程的堆栈跟踪。
- trace:生成对目前程序执行的分析文件,用于通过
go tool trace进行分析,可以通过GET请求参数指定时间范围。
以及点击 full goroutine stack dump 将会列出各个协程详细的调用栈信息。
2.1.2 终端命令行分析
同样要先运行程序,然后在程序运行的期间终端执行命令,命令参数为 go tool pprof <url> 的格式,不同的 url 表示进行不同的分析类型以及指定的参数。
执行命令时需要程序正在运行状态,以进行信息采集。进入 pprof 的命令行交互后,实际上是将程序当前运行的情况,以 profile 文件保存在目录 ~/pprof/ 中并进行分析了,程序本身中止运行不会对当前执行 pprof 的命令有所影响。
CPU Profiling
分析程序的CPU使用情况,在终端执行命令:
$ go tool pprof http://localhost:8080/debug/pprof/profile
Fetching profile over HTTP from http://localhost:8080/debug/pprof/profile
Saved profile in /Users/moondo/pprof/pprof.samples.cpu.006.pb.gz
Type: cpu
Duration: 30.07s, Total samples = 530ms ( 1.76%)
Entering interactive mode (type "help" for commands, "o" for options)
(pprof)
默认为采集30秒数据,所以执行后需要等待30秒后才可以进入命令行交互模式,可以在请求地址设置参数 seconds=60,表示采集60秒或其它时长的数据进行分析。
查看CPU耗时前10的函数:
(pprof) top 10
Showing nodes accounting for 530ms, 100% of 530ms total
Showing top 10 nodes out of 46
      flat  flat%   sum%        cum   cum%
     190ms 35.85% 35.85%      190ms 35.85%  runtime.kevent
     110ms 20.75% 56.60%      110ms 20.75%  runtime.pthread_cond_wait
      70ms 13.21% 69.81%       70ms 13.21%  syscall.syscall
      50ms  9.43% 79.25%       50ms  9.43%  runtime.nanotime1
      50ms  9.43% 88.68%       50ms  9.43%  runtime.pthread_cond_signal
      30ms  5.66% 94.34%      240ms 45.28%  runtime.netpoll
      20ms  3.77% 98.11%       20ms  3.77%  runtime.read
      10ms  1.89%   100%       10ms  1.89%  runtime.goready
         0     0%   100%       70ms 13.21%  internal/poll.(*FD).Write
         0     0%   100%       70ms 13.21%  internal/poll.ignoringEINTRIO (inline)
还有其它很多命令可以执行 help 查看说明。
Heap Profiling
分析程序的内存使用情况,在终端执行命令:
$ go tool pprof http://localhost:8080/debug/pprof/heap
Fetching profile over HTTP from http://localhost:8080/debug/pprof/heap
Saved profile in /Users/moondo/pprof/pprof.alloc_objects.alloc_space.inuse_objects.inuse_space.003.pb.gz
Type: inuse_space
Entering interactive mode (type "help" for commands, "o" for options)
(pprof)
该命令无需等待直接进入命令行,且默认分析的是常驻内存的占用,也可以在参数中选择分析常驻内存占用或者临时的内存分配情况。
# 内存占用
$ go tool pprof -inuse_space http://localhost:8080/debug/pprof/heap
Fetching profile over HTTP from http://localhost:8080/debug/pprof/heap
Saved profile in /Users/moondo/pprof/pprof.alloc_objects.alloc_space.inuse_objects.inuse_space.007.pb.gz
Type: inuse_space
Entering interactive mode (type "help" for commands, "o" for options)
(pprof) top 10
Showing nodes accounting for 5.29MB, 100% of 5.29MB total
      flat  flat%   sum%        cum   cum%
    5.29MB   100%   100%     5.29MB   100%  main.add (inline)
         0     0%   100%     5.29MB   100%  main.main.func1

# 内存分配
$ go tool pprof -alloc_objects http://localhost:8080/debug/pprof/heap
Fetching profile over HTTP from http://localhost:8080/debug/pprof/heap
Saved profile in /Users/moondo/pprof/pprof.alloc_objects.alloc_space.inuse_objects.inuse_space.006.pb.gz
Type: alloc_objects
Entering interactive mode (type "help" for commands, "o" for options)
(pprof) top 10
Showing nodes accounting for 196619, 100% of 196675 total
Dropped 19 nodes (cum <= 983)
      flat  flat%   sum%        cum   cum%
    131083 66.65% 66.65%     131083 66.65%  main.add (inline)
     32768 16.66% 83.31%      32768 16.66%  fmt.Sprintf
     32768 16.66%   100%     196619   100%  main.main.func1
         0     0%   100%      32768 16.66%  log.Printf
Goroutine Profiling
分析程序的协程情况,在终端执行命令:
$ go tool pprof http://localhost:8080/debug/pprof/goroutine
Fetching profile over HTTP from http://localhost:8080/debug/pprof/goroutine
Saved profile in /Users/moondo/pprof/pprof.goroutine.001.pb.gz
Type: goroutine
Entering interactive mode (type "help" for commands, "o" for options)
(pprof)
该命令无需等待直接进入命令行。
使用traces命令打印所有的调用栈:
(pprof) traces
Type: goroutine
-----------+-------------------------------------------------------
         1   runtime.gopark
             runtime.netpollblock
             internal/poll.runtime_pollWait
             internal/poll.(*pollDesc).wait
             internal/poll.(*pollDesc).waitRead (inline)
             internal/poll.(*FD).Accept
             net.(*netFD).accept
             net.(*TCPListener).accept
             net.(*TCPListener).Accept
             net/http.(*Server).Serve
             net/http.(*Server).ListenAndServe
             net/http.ListenAndServe (inline)
             main.main
             runtime.main
-----------+-------------------------------------------------------
         1   runtime.gopark
             time.Sleep
             main.main.func1
-----------+-------------------------------------------------------
         1   runtime/pprof.runtime_goroutineProfileWithLabels
             runtime/pprof.writeRuntimeProfile
             runtime/pprof.writeGoroutine
             runtime/pprof.(*Profile).WriteTo
             net/http/pprof.handler.ServeHTTP
             net/http/pprof.Index
             net/http.HandlerFunc.ServeHTTP
             net/http.(*ServeMux).ServeHTTP
             net/http.serverHandler.ServeHTTP
             net/http.(*conn).serve
-----------+-------------------------------------------------------
         1   net/http.(*connReader).backgroundRead
-----------+-------------------------------------------------------
调用栈之间用横线分割,每个调用栈从下面的行调用到上面的行。
Mutex Profiling
互斥锁分析需要在代码中调用 runtime.SetMutexProfileFraction() 并设置参数大于0,以开启互斥锁的采集。
调整一下示例代码,开启多个协程往一个map中写数据,然后用互斥锁造成锁定的状态。
package main

import (
	"net/http"
	_ "net/http/pprof"
	"runtime"
	"sync"
)

func init() {
	runtime.SetMutexProfileFraction(1)
}

func main() {
	var m sync.Mutex
	var datas = make(map[int]struct{})
	for i := 0; i < 999; i++ {
		go func(i int) {
			m.Lock()
			defer m.Unlock()
			datas[i] = struct{}{}
		}(i)
	}
	_ = http.ListenAndServe(":8080", nil)
}
然后在终端执行命令:
$ go tool pprof http://localhost:8080/debug/pprof/mutex
Fetching profile over HTTP from http://localhost:8080/debug/pprof/mutex
Saved profile in /Users/moondo/pprof/pprof.contentions.delay.001.pb.gz
Type: delay
Entering interactive mode (type "help" for commands, "o" for options)
(pprof)
查看互斥量排名:
(pprof) top
Showing nodes accounting for 1.41ms, 100% of 1.41ms total
      flat  flat%   sum%        cum   cum%
    1.41ms   100%   100%     1.41ms   100%  sync.(*Mutex).Unlock
         0     0%   100%     1.41ms   100%  main.main.func1
查看指定函数的代码,可以看到引起互斥锁的函数以及开销:
(pprof) list main
Total: 1.41ms
ROUTINE ======================== main.main.func1 in /Users/moondo/go/src/test/cmd/pprof_http_mutex.go
         0     1.41ms (flat, cum)   100% of Total
         .          .     17:	for i := 0; i < 999; i++ {
         .          .     18:		go func(i int) {
         .          .     19:			m.Lock()
         .          .     20:			defer m.Unlock()
         .          .     21:			datas[i] = struct{}{}
         .     1.41ms     22:		}(i)
         .          .     23:	}
         .          .     24:	_ = http.ListenAndServe(":8080", nil)
         .          .     25:}
Block Profiling
阻塞分析需要在代码中调用 runtime.SetBlockProfileRate() 并设置参数大于0,以开启阻塞情况的采集。
与互斥锁分析的代码类似,但初始化的函数换了:
package main

import (
	"net/http"
	_ "net/http/pprof"
	"runtime"
	"sync"
)

func init() {
	runtime.SetBlockProfileRate(1)
}

func main() {
	var m sync.Mutex
	var datas = make(map[int]struct{})
	for i := 0; i < 999; i++ {
		go func(i int) {
			m.Lock()
			defer m.Unlock()
			datas[i] = struct{}{}
		}(i)
	}
	_ = http.ListenAndServe(":8080", nil)
}
然后在终端执行命令:
$ go tool pprof http://localhost:8080/debug/pprof/block
Fetching profile over HTTP from http://localhost:8080/debug/pprof/block
Saved profile in /Users/moondo/pprof/pprof.contentions.delay.002.pb.gz
Type: delay
Entering interactive mode (type "help" for commands, "o" for options)
(pprof)
查看阻塞排名:
(pprof) top
Showing nodes accounting for 133.40ms, 100% of 133.40ms total
      flat  flat%   sum%        cum   cum%
  133.40ms   100%   100%   133.40ms   100%  sync.(*Mutex).Lock (inline)
         0     0%   100%   133.40ms   100%  main.main.func1
查看指定函数的代码,可以看到引起阻塞的函数以及开销:
(pprof) list main
Total: 133.40ms
ROUTINE ======================== main.main.func1 in /Users/moondo/go/src/test/cmd/pprof_http_block.go
         0   133.40ms (flat, cum)   100% of Total
         .          .     14:func main() {
         .          .     15:	var m sync.Mutex
         .          .     16:	var datas = make(map[int]struct{})
         .          .     17:	for i := 0; i < 999; i++ {
         .          .     18:		go func(i int) {
         .   133.40ms     19:			m.Lock()
         .          .     20:			defer m.Unlock()
         .          .     21:			datas[i] = struct{}{}
         .          .     22:		}(i)
         .          .     23:	}
         .          .     24:	_ = http.ListenAndServe(":8080", nil)
2.1.3 可视化界面分析
还是使用前面提到的,开启一个协程对一个字符串不断地追加内容的例子。该方式将会打开一个有图形的可视化界面,使分析更加直观优雅。使用该方式需要提前安装一个软件 graphviz。
执行程序,然后在终端通过 wget 或 curl 导出CPU分析的文件:
wget http://localhost:8080/debug/pprof/profile
curl -o profile http://localhost:8080/debug/pprof/profile
等待30秒后(CPU分析不带参数默认30秒),会在当前目录保存一个 profile 文件。
然后在终端执行命令,在指定端口号运行一个 pprof 分析网站,这里要换一个端口号,不要和现有程序执行的端口号重复了:
go tool pprof -http=:8081 profile
自动打开网站,默认显示的是程序调用的链路以及每个调用的耗时,在菜单选择 VIEW - Graph 也可以显示这个。
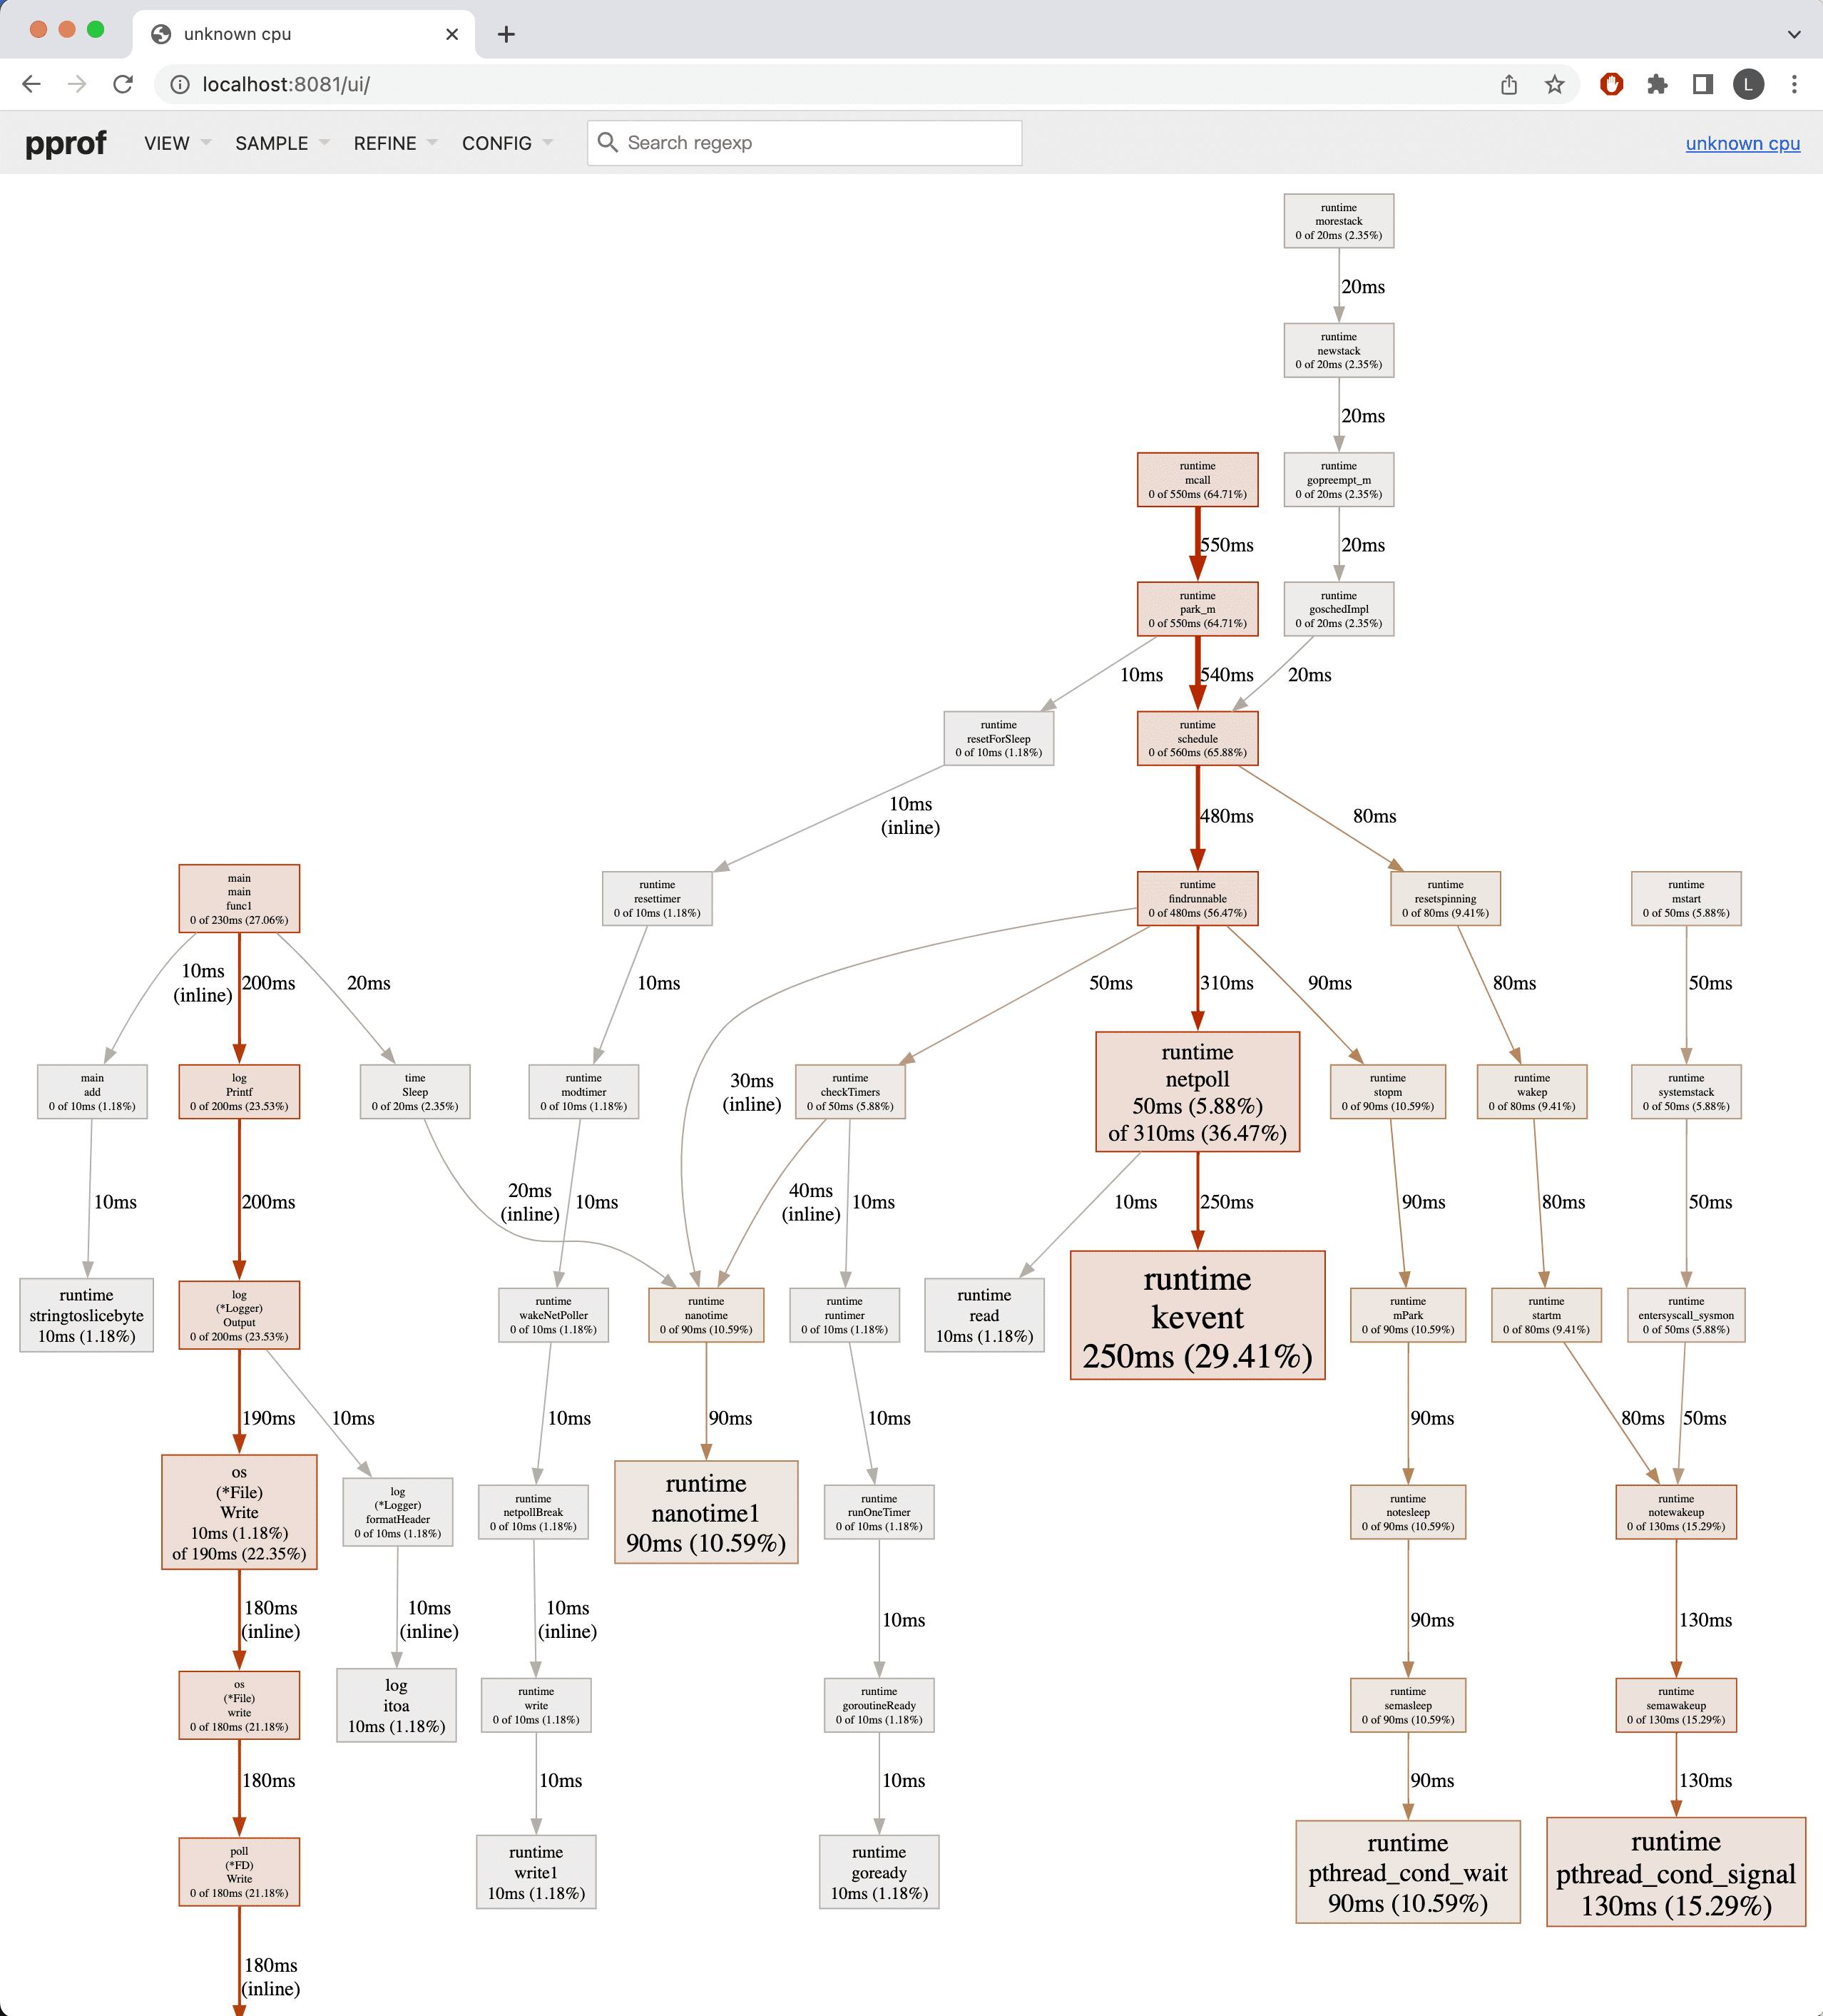
代码中主要做的事情是:开启一个协程,然后在循环中不断地给字符串追加内容、向标准输出输出一行日志,然后睡眠10毫秒。在上图左侧的main函数可以看到,往下的箭头指向了三块,分别对应 add 函数耗时 10ms,log.Printf 函数耗时 200ms,time.Sleep 函数耗时 20ms。由此可以分析得出结论,打印日志到标准输出比其他两项更加耗时。
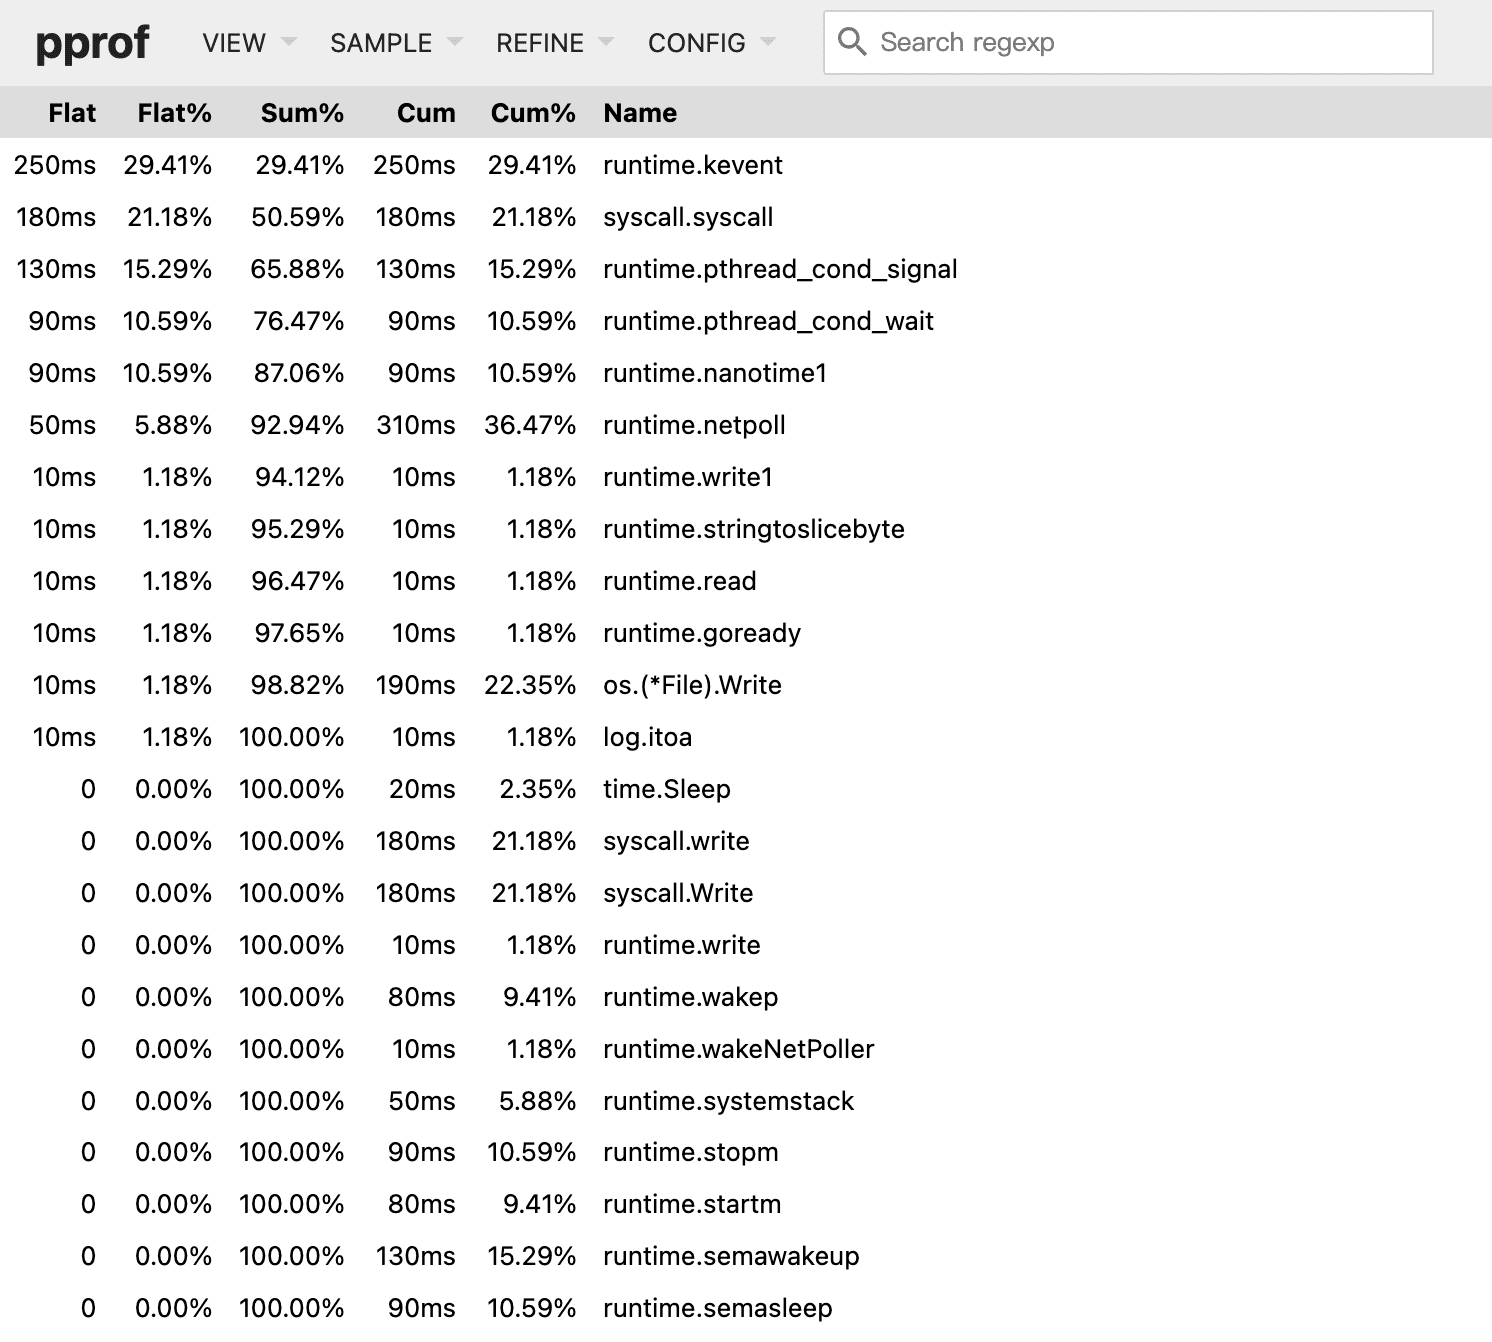
在菜单选择 VIEW - Top 可以列出CPU使用量的列表,并且可以选择排序的列。
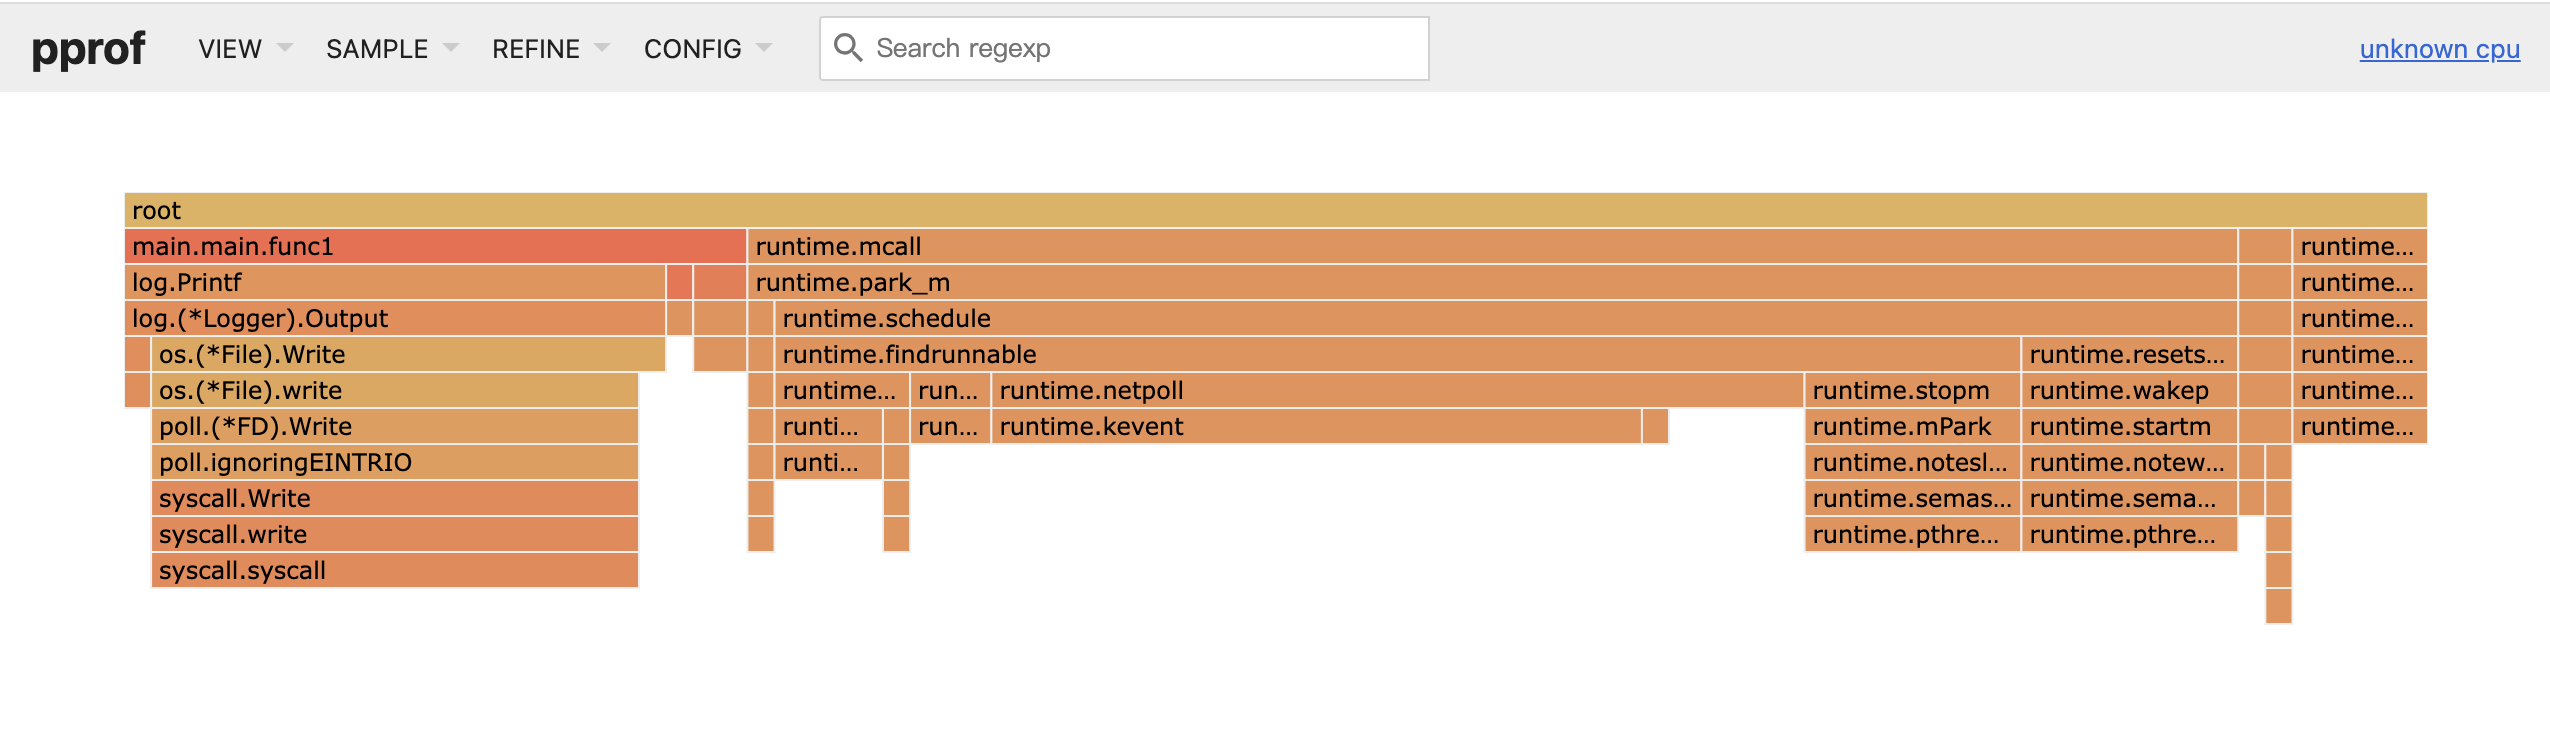
在菜单选择 VIEW - Flame Graph 可以输出火焰图,很直观地展示出各个函数调用以及占用CPU时间的多少。
上述导出的是CPU分析的文件,根据请求不同可以导出不同类型的分析文件:
# CPU分析及运行分析网站
wget http://localhost:8080/debug/pprof/profile
go tool pprof -http=:8081 profile

# 内存占用分析及运行分析网站
wget http://localhost:8080/debug/pprof/heap
go tool pprof -http=:8081 heap

# 内存分配分析及运行分析网站
wget http://localhost:8080/debug/pprof/allocs
go tool pprof -http=:8081 allocs

# Goroutine分析及运行分析网站
wget http://localhost:8080/debug/pprof/goroutine
go tool pprof -http=:8081 goroutine

# 互斥锁分析及运行分析网站
wget http://localhost:8080/debug/pprof/mutex
go tool pprof -http=:8081 mutex

# 阻塞分析及运行分析网站
wget http://localhost:8080/debug/pprof/block
go tool pprof -http=:8081 block

# trace分析及运行分析网站
curl -o trace.out http://localhost:8080/debug/pprof/trace?seconds=5
go tool trace trace.out
每种类型的分析网站菜单都是一样的,而打开的列表、链路图、火焰图则是对应不同资源的情况,不再一一展示。
2.2 runtime/pprof 生成 pprof 文件
该方式适合于工具型应用,在执行的代码中间通过使用 runtime/pprof 包,生成一个 pprof 文件,然后对该文件以命令行、浏览器等形式进行数据分析。
示例代码:对一个字符串循环追加内容1000次。
CPU分析需要分析一段时间内的CPU耗时情况,因此先创建 pprof 文件,执行目标代码,然后再关闭 pprof 文件。执行完该程序后,将会在当前目录保存一个 cpu.pprof 文件,然后可以对该文件进行分析。示例代码:
import (
	"runtime/pprof"
)

func main() {
	cpu_pprof, _ := os.Create("cpu.pprof")
	_ = pprof.StartCPUProfile(cpu_pprof)
    // do sth
	pprof.StopCPUProfile()
	_ = file.Close()
	_ = cpu_pprof.Close()
}
内存分析是记录某个时刻的内存信息,所以直接创建一个 pprof 文件并写入,然后关闭。示例代码:
import (
	"runtime/pprof"
)

func main() {
    // do sth
	runtime.GC()
	heap_pprof, _ := os.Create("heap.pprof")
	_ = pprof.WriteHeapProfile(heap_pprof)
	_ = heap_pprof.Close()
}
2.2.1 终端命令行分析
和上面通过端口监听方式进入 pprof 命令行类似,不过参数从 url 换成了文件名,在终端执行命令:
$ go tool pprof cpu.pprof
Type: cpu
Duration: 10.67s, Total samples = 220ms ( 2.06%)
Entering interactive mode (type "help" for commands, "o" for options)
(pprof)
help 命令查看命令帮助,top 命令查看CPU耗时前10的函数。
2.2.2 可视化界面分析
上面通过端口监听方式是通过 wget 或 curl 从监听的端口获取 pprof 数据导出到文件,而现在直接就已经生成了一个 pprof 文件,因此我们可以直接在指定端口号运行一个 pprof 分析网站。
go tool pprof -http=:8081 cpu.pprof
可视化界面的内容和上面一致,不再重复说明了。
在 pprof 命令行使用 web 命令也可以在浏览器打开可视化的链路图svg文件,但是不能切换查看其它内容,因此不推荐这种方式。
2.3 go test 测试用例
还可以通过测试用例来进行程序性能分析。
代码示例:
// add.go
var datas []string

func add(str string) int {
	data := []byte(str)
	datas = append(datas, string(data))
	return len(datas)
}

// add_test.go
import "testing"

func TestAdd(t *testing.T) {
	_ = add("go pprof add text")
}

func BenchmarkAdd(b *testing.B) {
	for i := 0; i < b.N; i++ {
		add("go pprof add text")
	}
}
在终端执行命令,以下命令分别对应CPU分析和内存分析:
go test -bench=. -cpuprofile=cpu.profile
go test -bench=. -memprofile=mem.profile
将会生成一个 pprof 文件,然后可以指定该文件,执行命令进入命令行分析模式:
go tool pprof cpu.profile
或者运行一个 pprof 分析网站:
go tool pprof -http=:8081 cpu.profile
3. 实践
3.1 Gin 中间件
对基于 Gin 框架的服务来说,已经开启了端口监听并提供接口服务,可以通过在路由上注册的方式来使用 pprof。
开源 pprof 中间件:https://github.com/gin-contrib/pprof
下载包:
go get https://github.com/gin-contrib/pprof
在已有代码中添加:
import "github.com/gin-contrib/pprof"

func main() {
	app := gin.Default()
	pprof.Register(app) // 在初始化gin实例和监听端口之间添加该行
	app.Run(":8080")
}
然后运行该服务,就可以按照上面描述的方法,通过 pprof 相关命令来进行性能分析。
该包的实现非常简单,实现文件只有一个:https://github.com/gin-contrib/pprof/blob/master/pprof.go
核心代码如下,其实就是引入 net/http/pprof 包和 gin 的包,并在路由中给 pprof 的几个路径进行注册:
func RouteRegister(rg *gin.RouterGroup, prefixOptions ...string) {
	prefix := getPrefix(prefixOptions...)

	prefixRouter := rg.Group(prefix)
	{
		prefixRouter.GET("/", gin.WrapF(pprof.Index))
		prefixRouter.GET("/cmdline", gin.WrapF(pprof.Cmdline))
		prefixRouter.GET("/profile", gin.WrapF(pprof.Profile))
		prefixRouter.POST("/symbol", gin.WrapF(pprof.Symbol))
		prefixRouter.GET("/symbol", gin.WrapF(pprof.Symbol))
		prefixRouter.GET("/trace", gin.WrapF(pprof.Trace))
		prefixRouter.GET("/allocs", gin.WrapH(pprof.Handler("allocs")))
		prefixRouter.GET("/block", gin.WrapH(pprof.Handler("block")))
		prefixRouter.GET("/goroutine", gin.WrapH(pprof.Handler("goroutine")))
		prefixRouter.GET("/heap", gin.WrapH(pprof.Handler("heap")))
		prefixRouter.GET("/mutex", gin.WrapH(pprof.Handler("mutex")))
		prefixRouter.GET("/threadcreate", gin.WrapH(pprof.Handler("threadcreate")))
	}
}
3.2 goroutine 泄漏排查
以下用一个 goroutine 泄漏的例子,展示如何通过 pprof 发现定位 goroutine 泄漏问题。
示例程序如下,开启端口监听后,新建一个通道,每秒钟起100个 goroutine,每个 goroutine 中向通道写入数据,永不从通道读取数据,造成阻塞,创建 goroutine 数量就会一直增加。
package main

import (
	"fmt"
	"net/http"
	_ "net/http/pprof"
	"time"
)

func main() {
	go func() {
		_ = http.ListenAndServe(":8080", nil)
	}()

	outCh := make(chan int)
	go func() {
		if false { // 永不读取
			<-outCh
		}
		select {}
	}()

	// 每秒起100个goroutine,goroutine会阻塞,不释放内存
	tick := time.Tick(time.Second / 100)
	i := 0
	for range tick {
		i++
		go alloc(outCh)
		fmt.Println("goroutine %d", i)
	}
}

func alloc(outCh chan<- int) {
	outCh <- 0
}
先后两次生成 goroutine 分析文件,获得 goroutine 和 goroutine.1:
wget http://localhost:8080/debug/pprof/goroutine
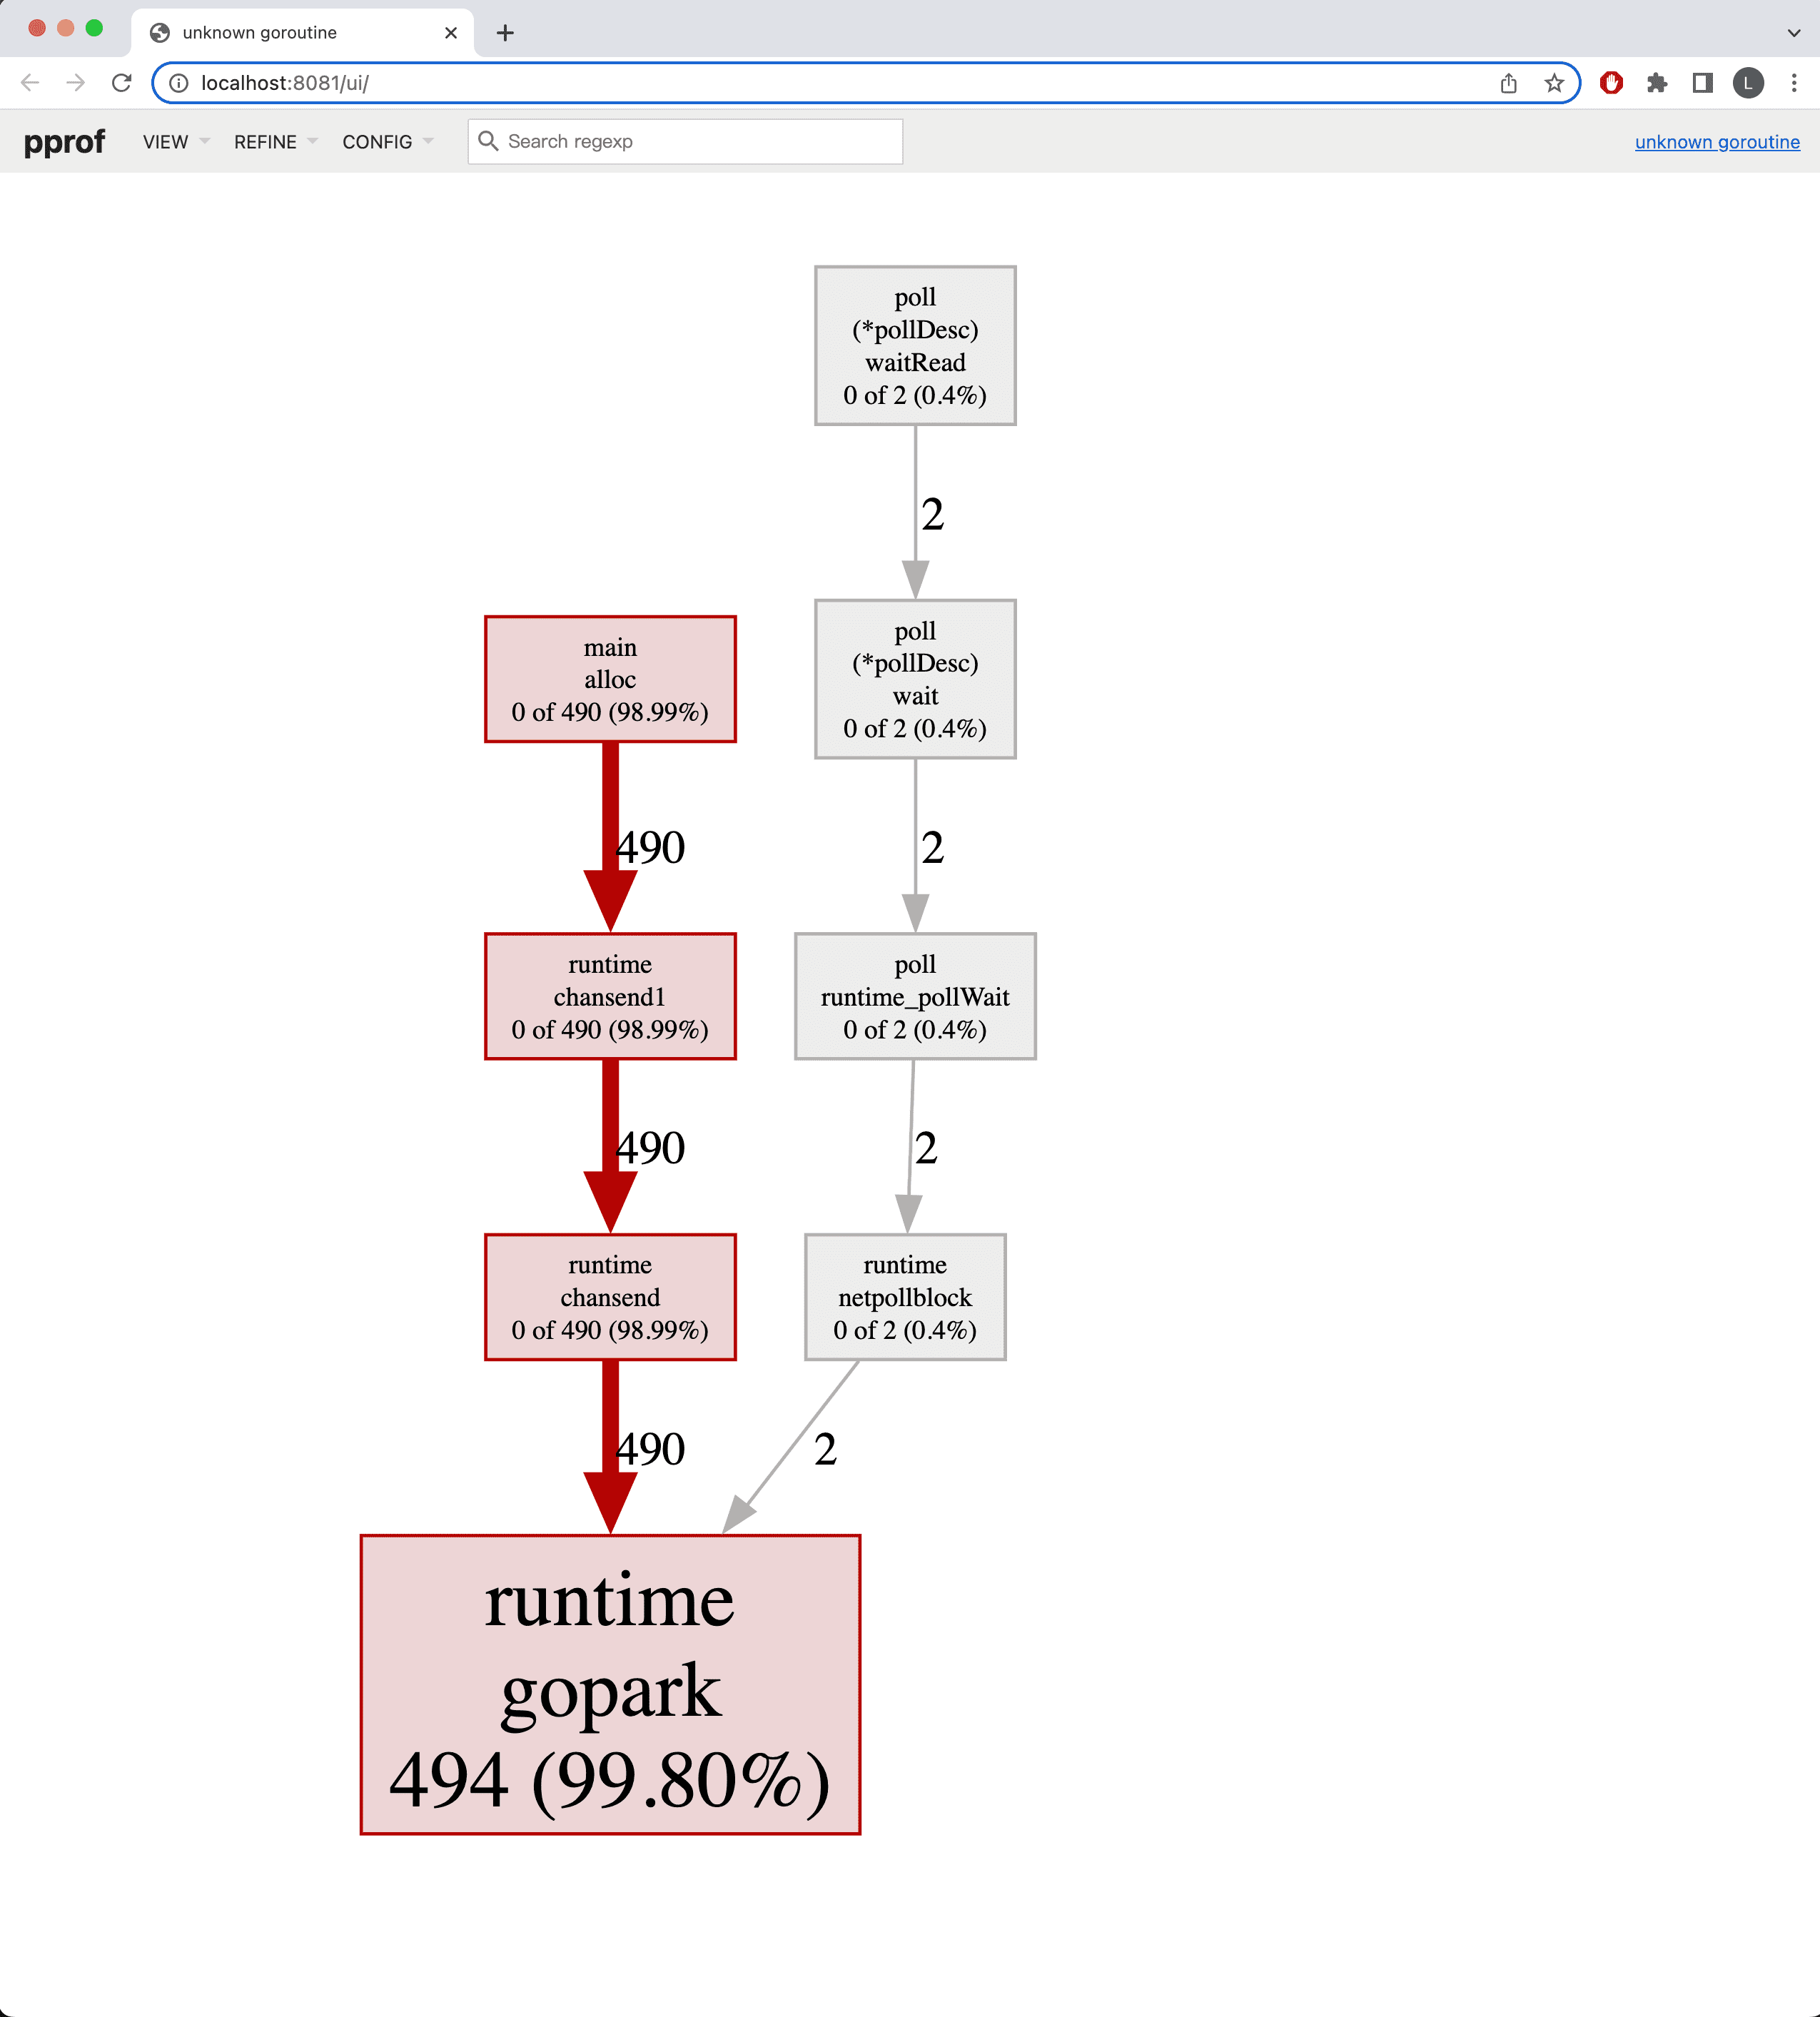
比较两个 pprof 文件,top 命令可以看到运行到 runtime.gopark 函数的 goroutine 数量增加了2530个,runtime.gopark 函数用于将当前 goroutine 放入等待状态,停止被运行时调度器调度。traces 命令可以看到这些 runtime.gopark 函数调用的调用栈。list 命令可以清楚看到,造成 goroutine 泄漏的 runtime.gopark 函数调用,是由此处 outCh <- 0 被阻塞造成的。
$ go tool pprof -base goroutine goroutine.1
Type: goroutine
Entering interactive mode (type "help" for commands, "o" for options)
(pprof) top
Showing nodes accounting for 2530, 100% of 2530 total
      flat  flat%   sum%        cum   cum%
      2530   100%   100%       2530   100%  runtime.gopark
         0     0%   100%       2530   100%  main.alloc
         0     0%   100%       2530   100%  runtime.chansend
         0     0%   100%       2530   100%  runtime.chansend1
(pprof) traces
Type: goroutine
-----------+-------------------------------------------------------
      2530   runtime.gopark
             runtime.chansend
             runtime.chansend1
             main.alloc
-----------+-------------------------------------------------------
(pprof) list main.alloc
Total: 2530
ROUTINE ======================== main.alloc in /Users/moondo/go/src/test/cmd/pprof_goroutine_leak.go
         0       2530 (flat, cum)   100% of Total
         .          .     29:		fmt.Println("goroutine %d", i)
         .          .     30:	}
         .          .     31:}
         .          .     32:
         .          .     33:func alloc(outCh chan<- int) {
         .       2530     34:	outCh <- 0
         .          .     35:}
再对 pprof 文件通过可视化界面进行分析:
go tool pprof -http=:8081 goroutine
调用图可以看到几乎所有 goroutine 都走向了 runtime.gopark,也就是 goroutine 被大量暂停了。
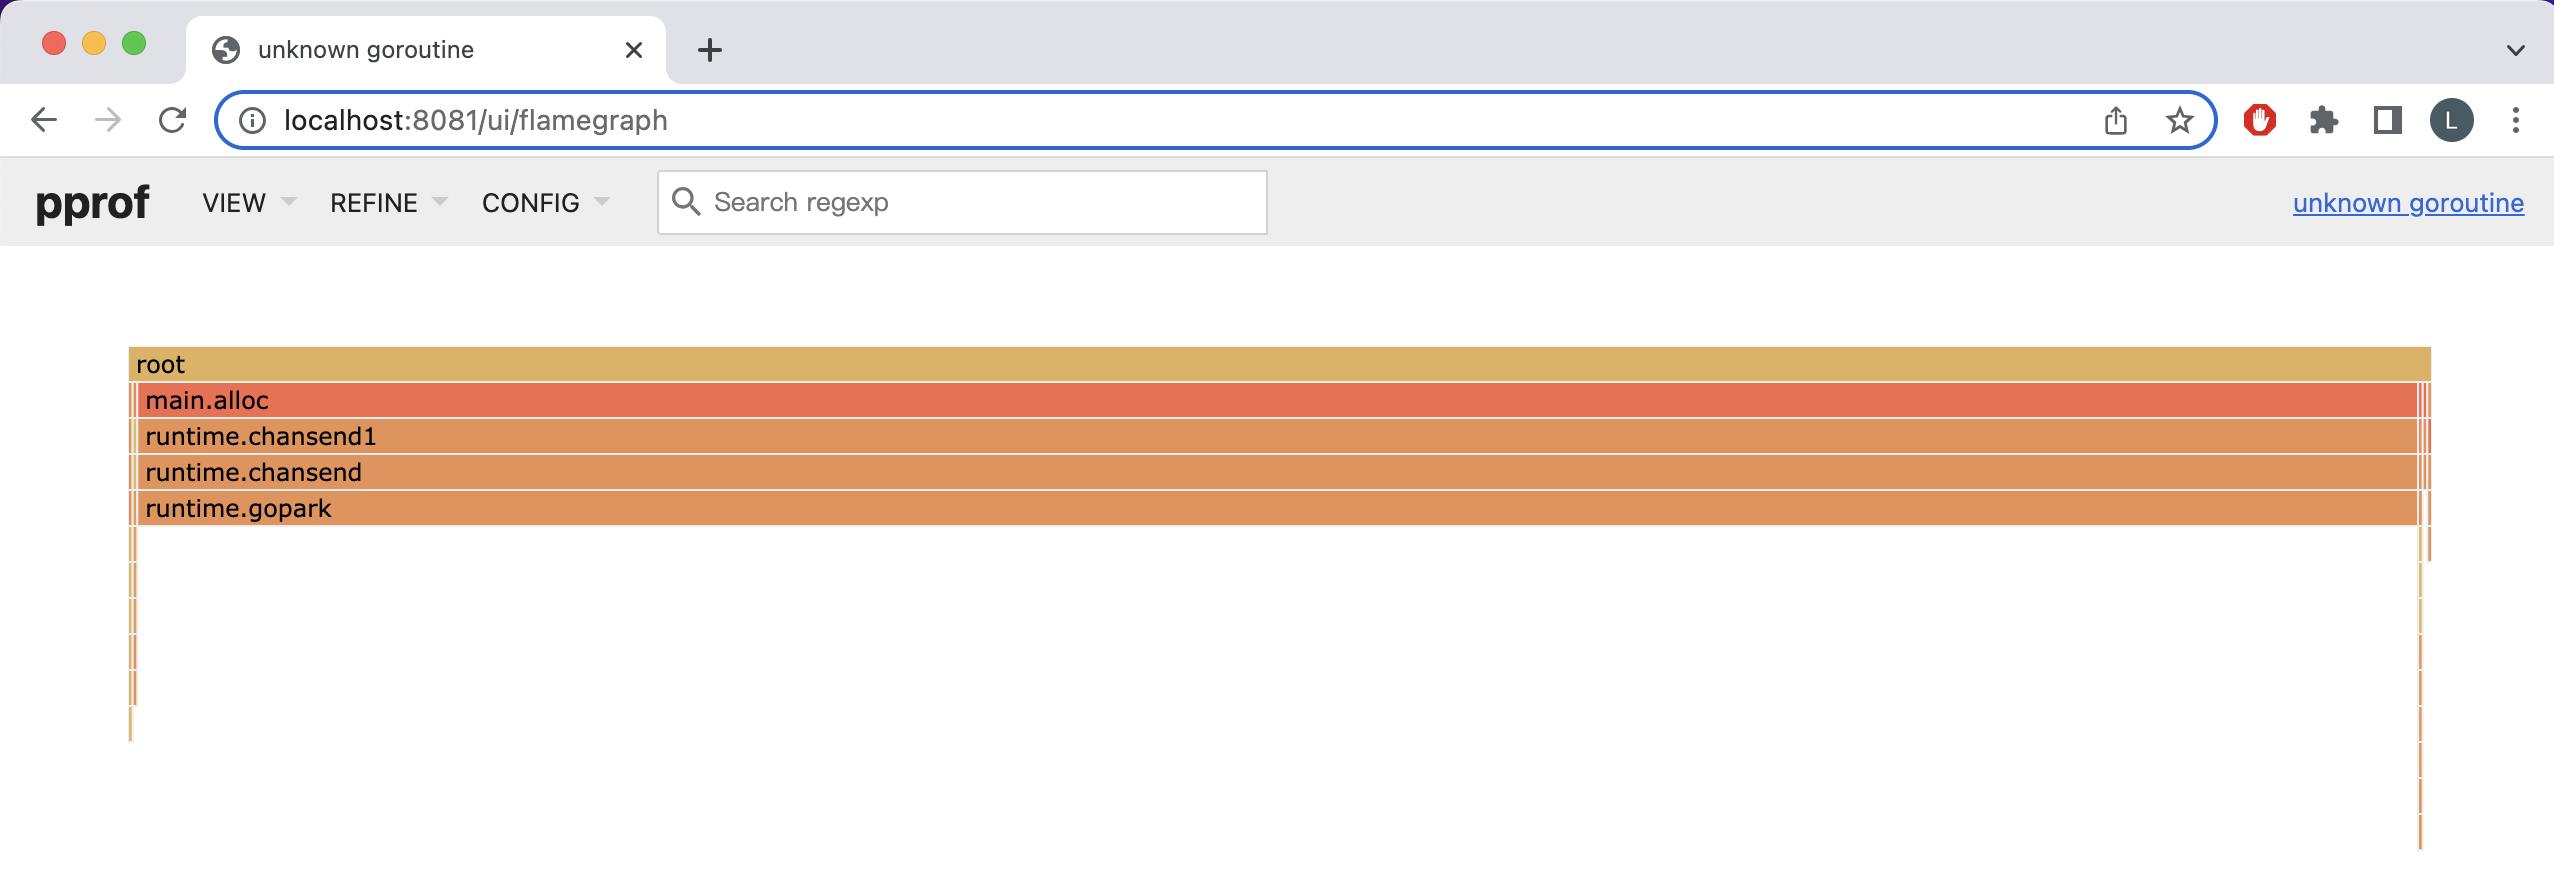
通过火焰图,同样是几乎所有 goroutine 都在 runtime.gopark。
调整代码,对通道进行读取:
package main

import (
	"fmt"
	"net/http"
	_ "net/http/pprof"
	"time"
)

func main() {
	go func() {
		_ = http.ListenAndServe(":8080", nil)
	}()

	outCh := make(chan int)
	go func() {
		for {
			<-outCh // 读取通道
		}
	}()

	// 每秒起100个goroutine,goroutine会阻塞,不释放内存
	tick := time.Tick(time.Second / 100)
	i := 0
	for range tick {
		i++
		go alloc(outCh)
		fmt.Println("goroutine %d", i)
	}
}

func alloc(outCh chan<- int) {
	outCh <- 0
}
先后两次生成 goroutine 分析文件,获得 goroutine 和 goroutine.1:
wget http://localhost:8080/debug/pprof/goroutine
比较两个 pprof 文件,看到两个文件之间协程间的差别消失了。
$ go tool pprof -base goroutine goroutine.1
Type: goroutine
Entering interactive mode (type "help" for commands, "o" for options)
(pprof) top
Showing nodes accounting for 0, 0% of 0 total
      flat  flat%   sum%        cum   cum%
分别查看两个 pprof 文件,大量的 runtime.gopark 函数调用也消失了。
$ go tool pprof goroutine
Type: goroutine
Entering interactive mode (type "help" for commands, "o" for options)
(pprof) top
Showing nodes accounting for 5, 100% of 5 total
Showing top 10 nodes out of 33
      flat  flat%   sum%        cum   cum%
         4 80.00% 80.00%          4 80.00%  runtime.gopark
         1 20.00%   100%          1 20.00%  runtime/pprof.runtime_goroutineProfileWithLabels
         0     0%   100%          1 20.00%  internal/poll.(*FD).Accept
         0     0%   100%          1 20.00%  internal/poll.(*FD).Read
         0     0%   100%          2 40.00%  internal/poll.(*pollDesc).wait
         0     0%   100%          2 40.00%  internal/poll.(*pollDesc).waitRead (inline)
         0     0%   100%          2 40.00%  internal/poll.runtime_pollWait
         0     0%   100%          1 20.00%  main.main
         0     0%   100%          1 20.00%  main.main.func1
         0     0%   100%          1 20.00%  main.main.func2